LifeLearn Live! Dashboard
Product Design
Design process
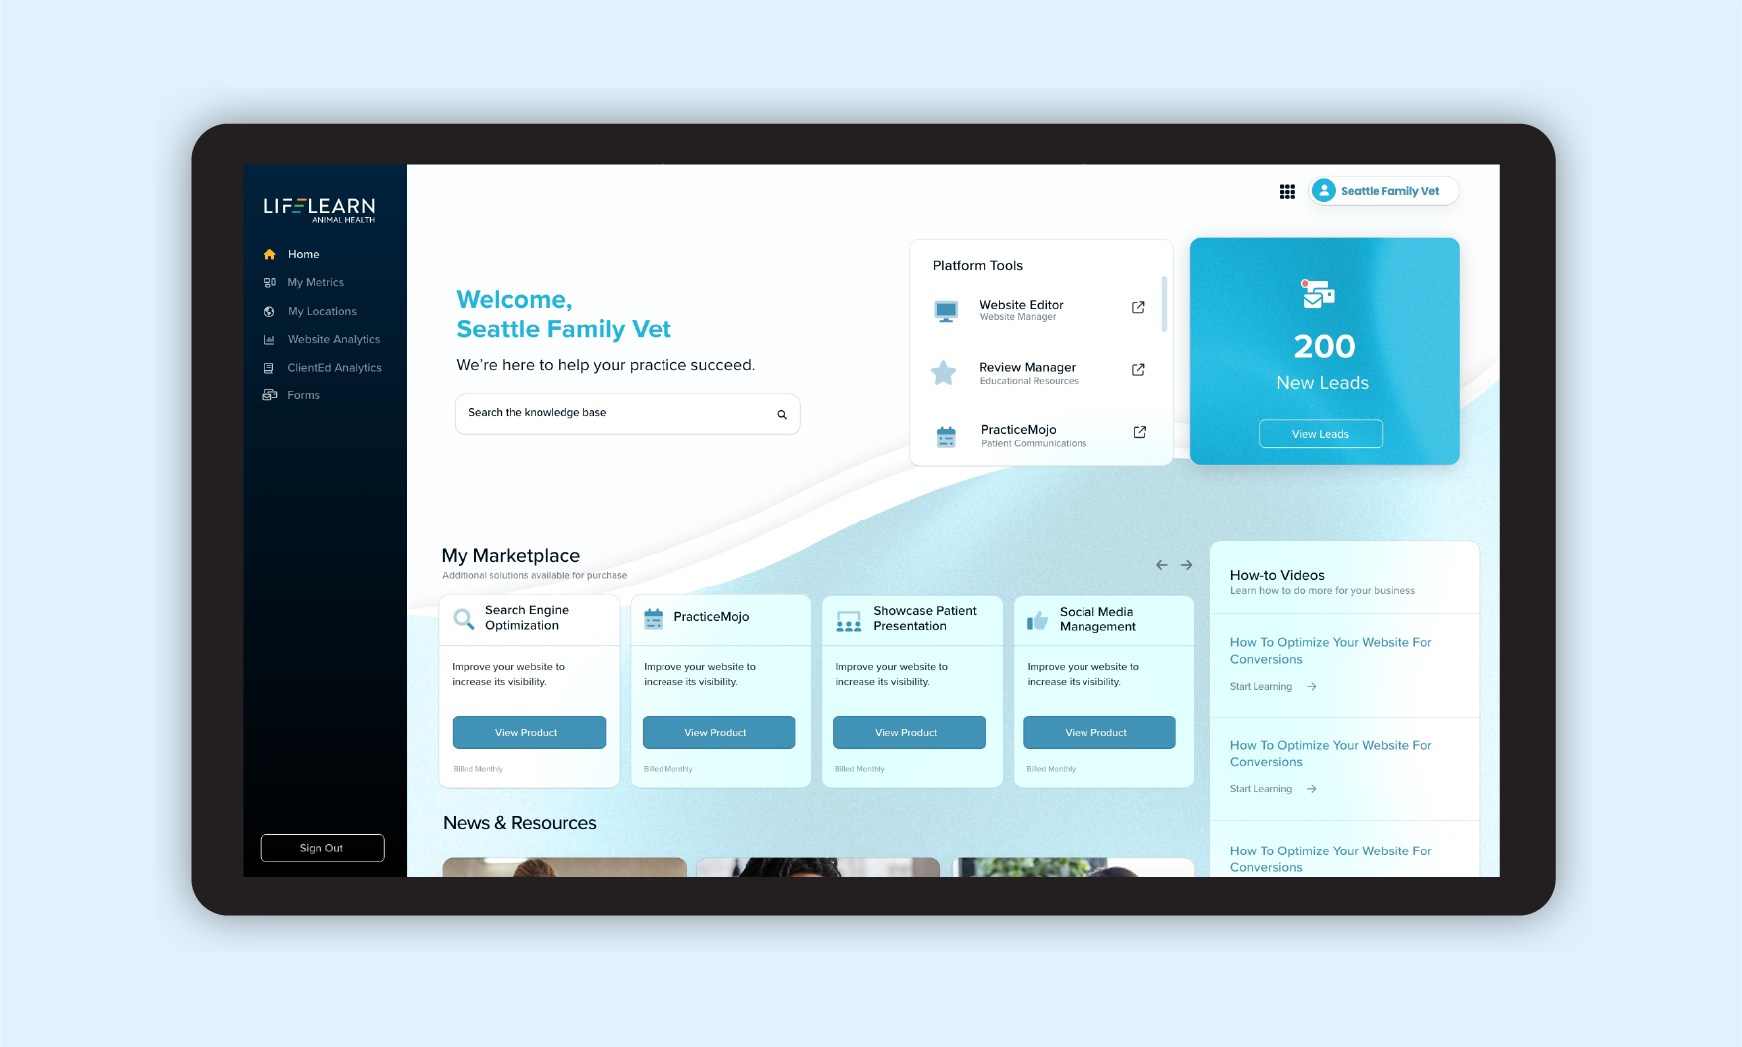
LifeLearn Live! is a performance dashboard that comes free with every LifeLearn product. It brings a practice's website, advertising and client engagement data into one place, with return on investment as the headline number.
The intent was to feel clear and confident without feeling like an analytics tool built for marketers. Our users are busy practice owners and managers, so the dashboard had to be trustworthy at a glance and only go deeper when they chose to.
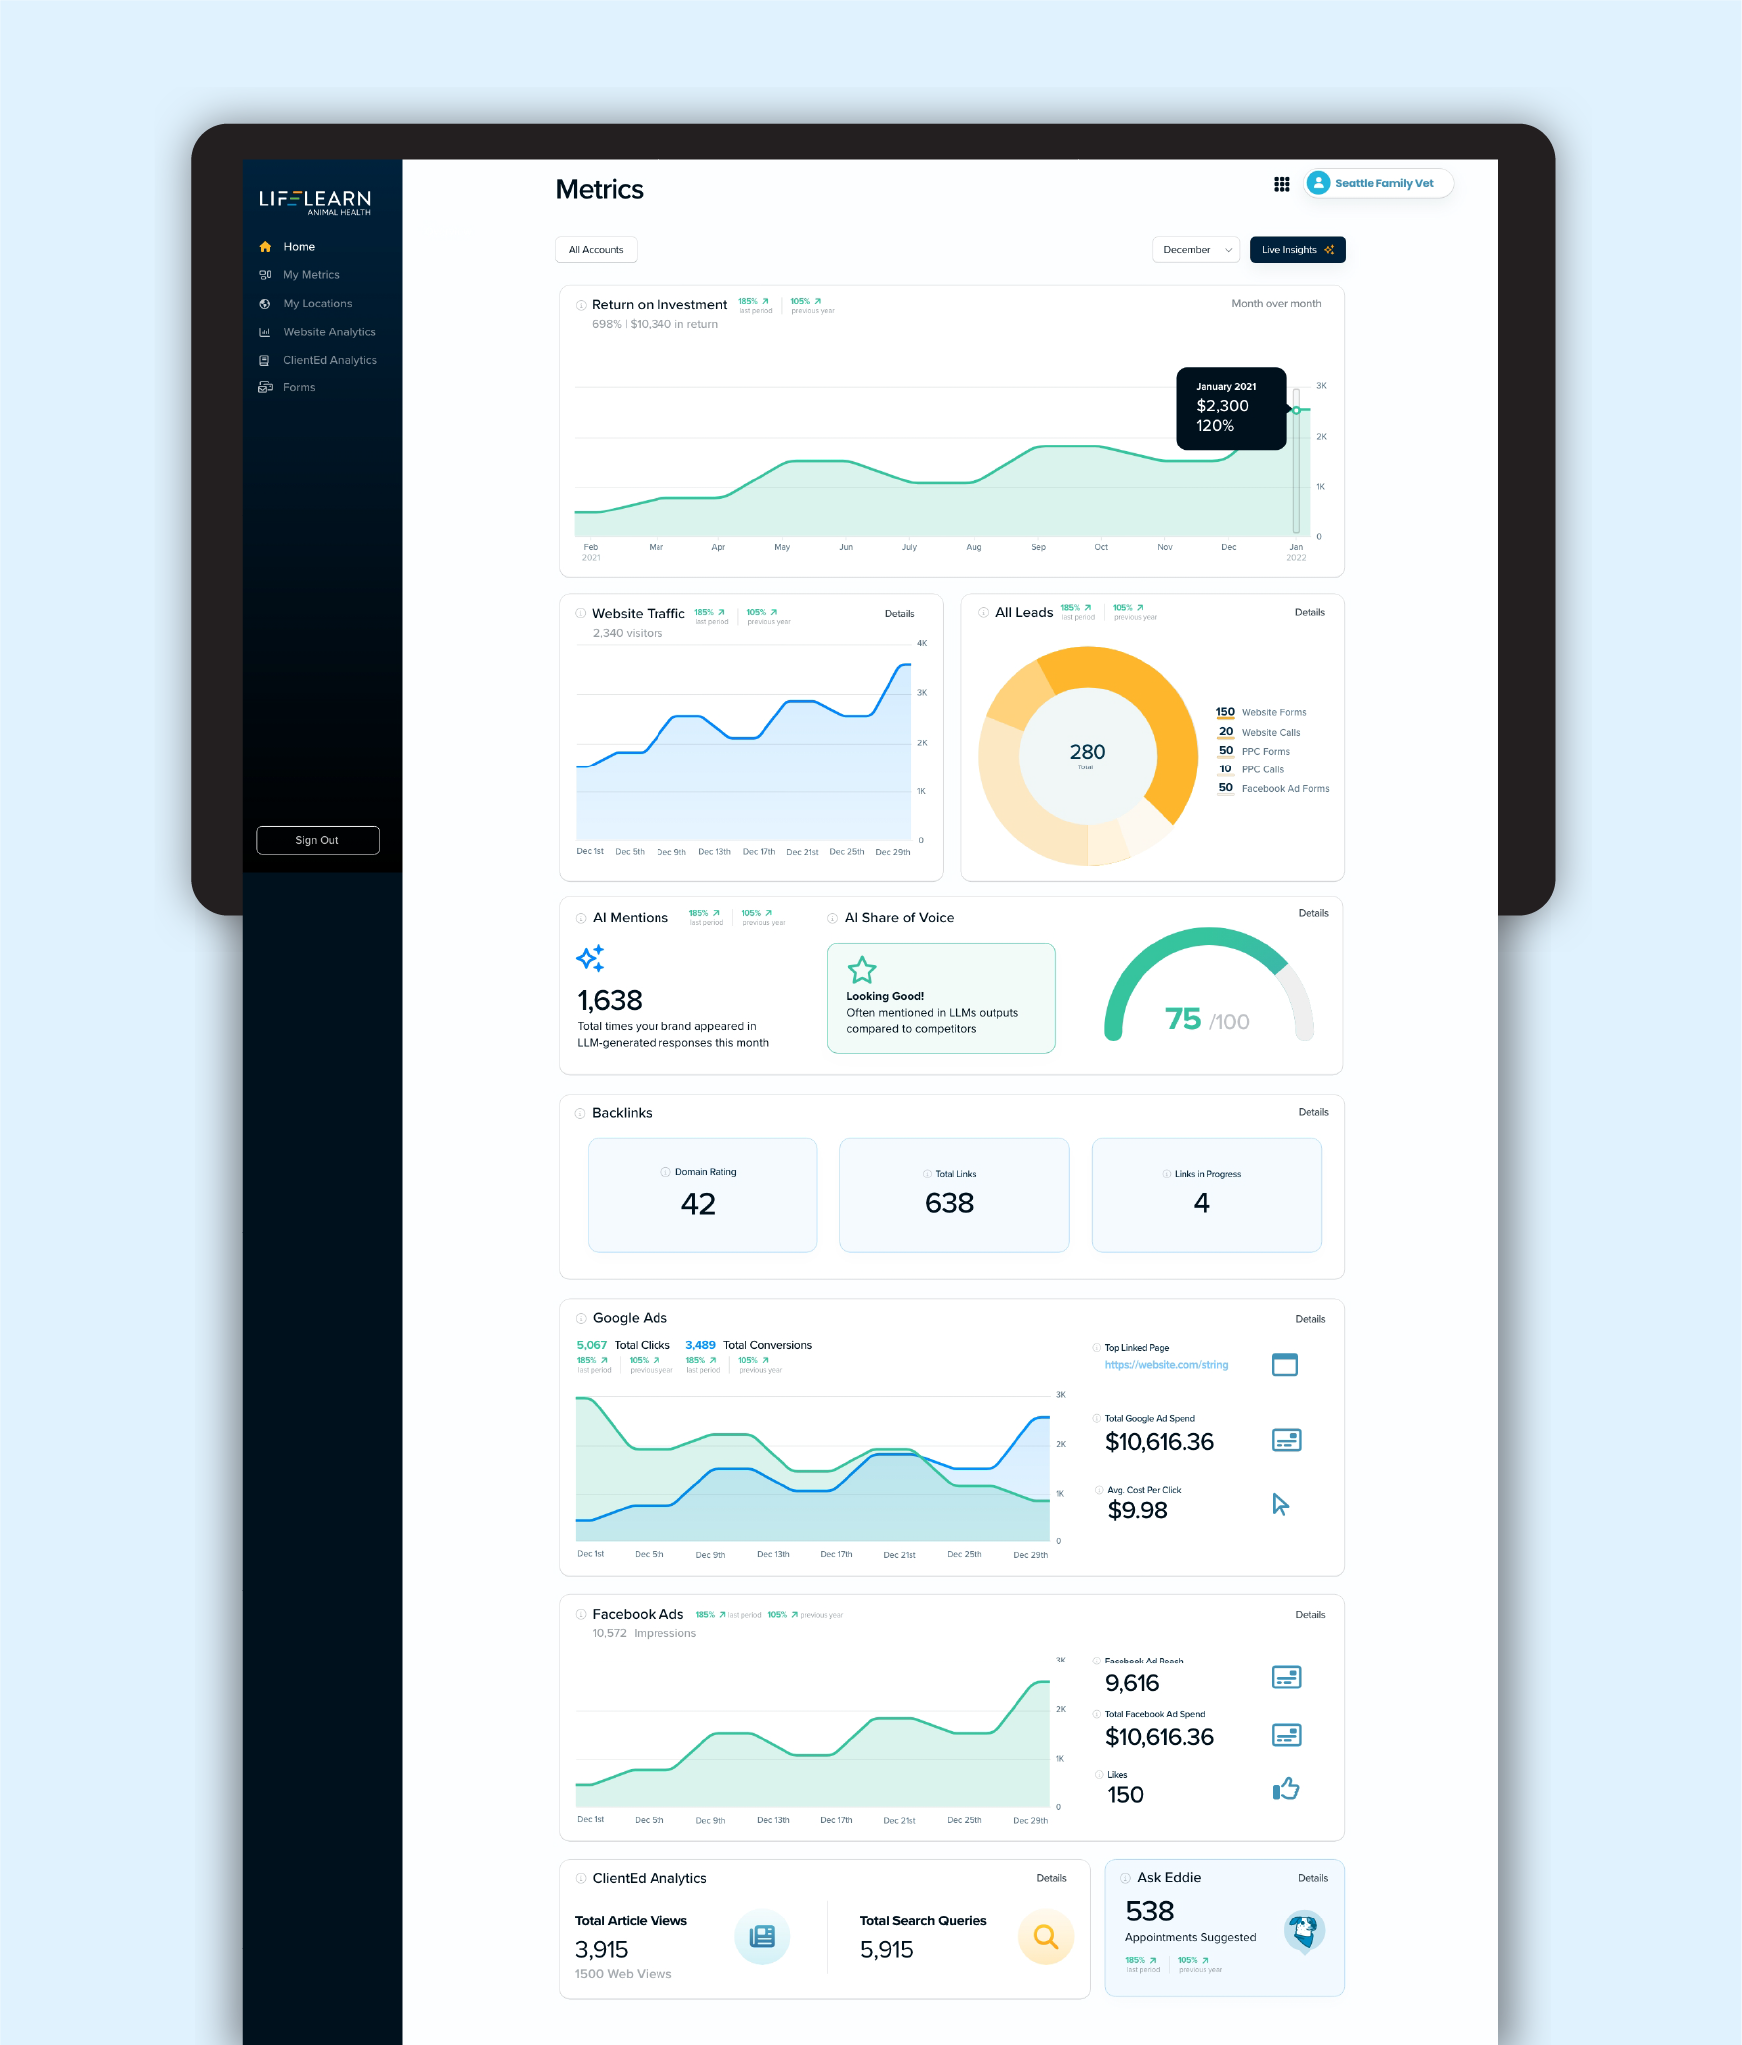
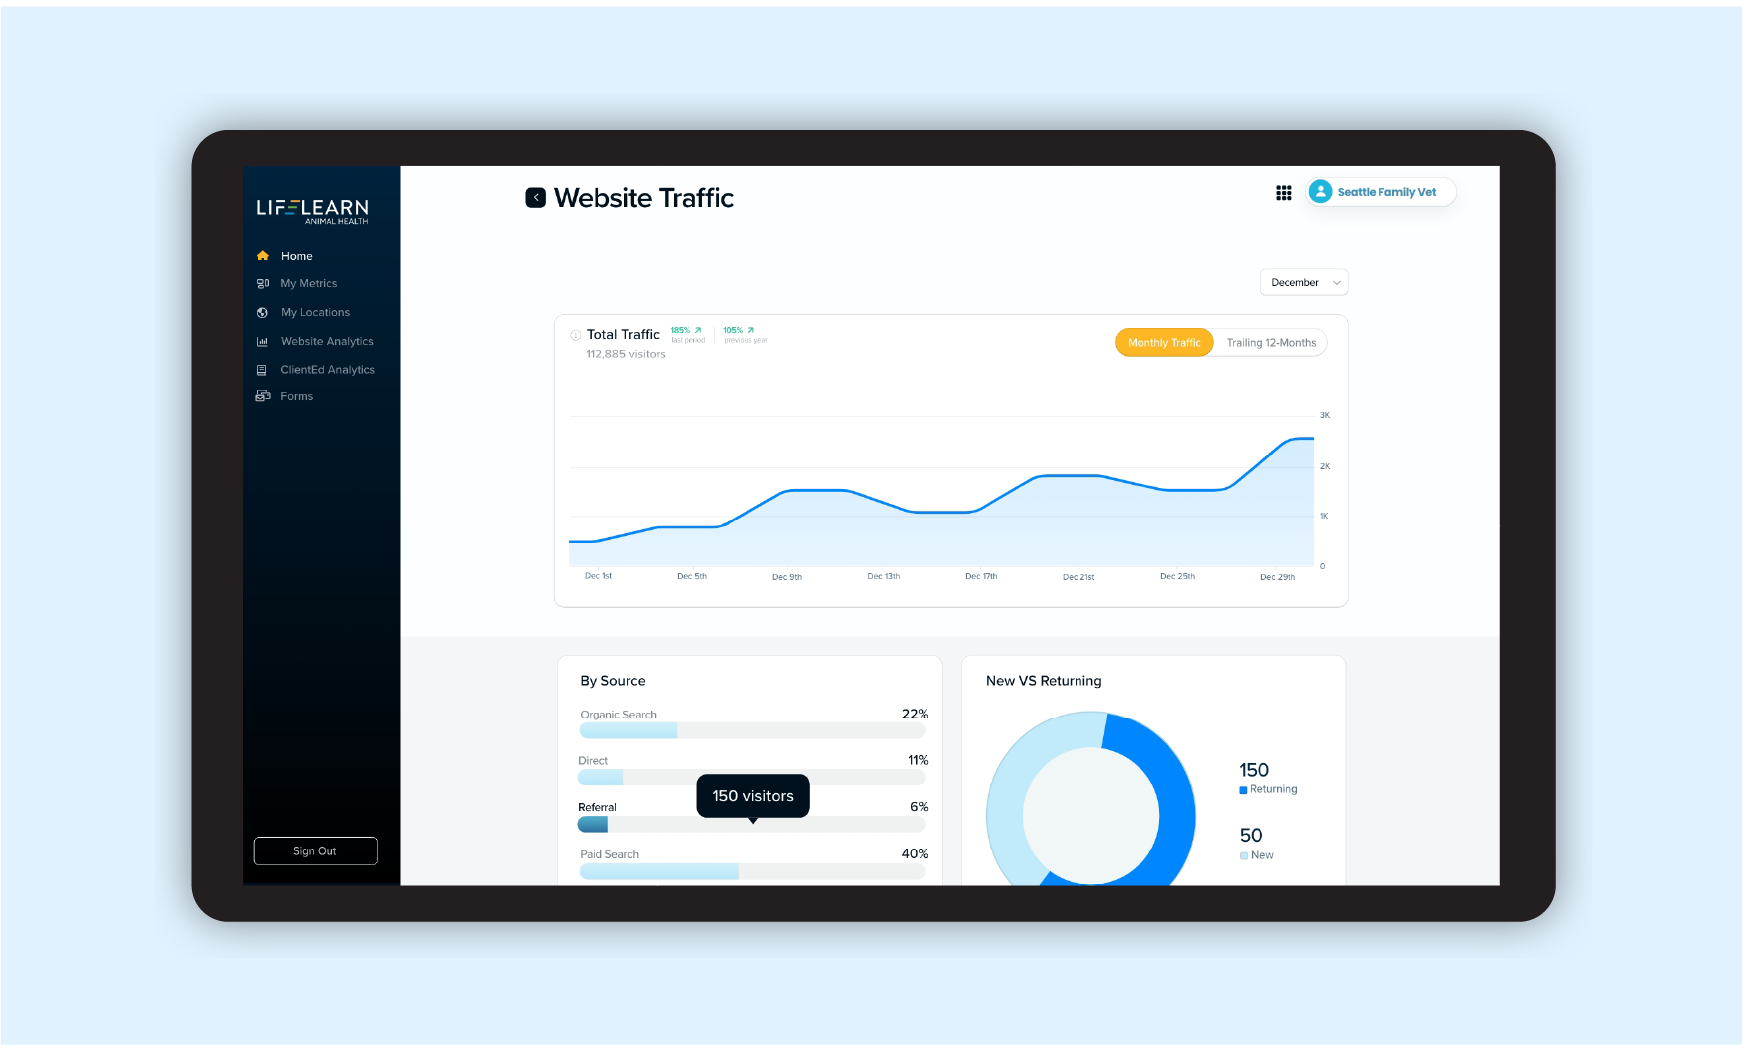
The UI/UX puts the most important answer first. ROI sits at the top of the page, with each channel (website traffic, leads, Google Ads, Facebook Ads, backlinks) in its own card below it, with period-over-period comparisons built in. Each card has a "Details" link, which keeps the page scannable while still letting anyone drill in. An account switcher and a My Locations view let multi-hospital clients see their practices together or separately without juggling logins. AI Mentions and AI Share of Voice are new metrics, so we paired a simple 0 to 100 score with a plain-language status ("Looking Good!") to keep them easy to understand.
High Fidelity Mockups